
TLDR; Monitoring LED Pulses on Power Meters to get real time energy consumption:
My electricity supplier upgraded me a smart meter at home about a year ago, I was quite excited by the prospect of having a smart meter and being able to monitor the power usage in real time – how mistaken I was. It seems the infrastructure for smart metering in New Zealand (and maybe worldwide) is very much an afterthought.
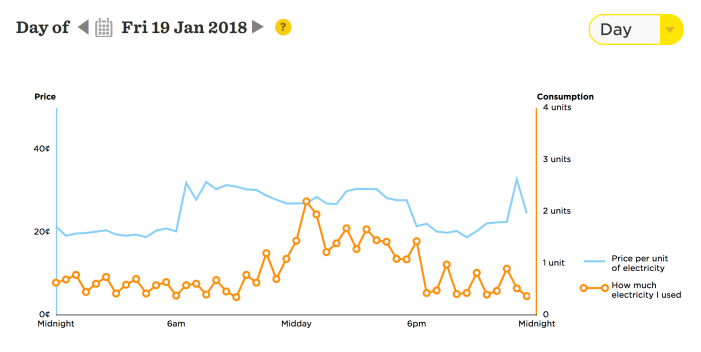
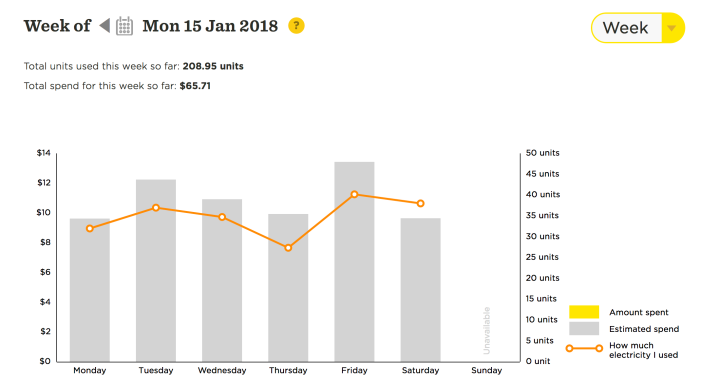
My electricity retailer is Flick Electric – who are fantastic and have a really neat concept of charging you whatever the spot price of power is at a given time + some fixed charges (which I expect is where their profit margin is) – this business model is really enabled by smart meters and the granularity on electricity consumption they provides retailers with.

The problem (let’s be honest – my problem) is that Flick don’t get the data from the metering company in real time (or even close to real time) – in fact there’s usually a 2-3 day lag somewhere between the smart meter, the metering company and my electricity retailer. The data is great, mind you – but it’s less interesting to me personally when it’s 2 days old.
My guess would be that metering infrastructure hasn’t been seriously looked at from an architectural perspective in many years – in reality really Smart Meters are just a ‘bolt-on’ after thought to existing metering infrastructure – i’m sure the same is true all over the world – don’t get me wrong i’m not trying to cast aspersions here – it’s the nature of Information Technology in general – as a seasoned network engineer colleague of mine often says “everything is awful”.
Consumers have always been able to get an indication of current power consumption by looking at the meter itself – older meters have a spinning metal dial which operates on an electro-mechanical principle which is really quite cool.
Modern meters are fed analog voltage and current inputs and convert to a digital signal for recording and ultimately display on the LCD panel that will be read off by a meter reader.
These newer style of meter form the basis of what are referred to as ‘smart’ meters – which are essentially add-in modules with some sort of communications technology built in (Such as GPRS or Zigbee) these send the data back to the metering company – who act as the broker to the electricity retailer.
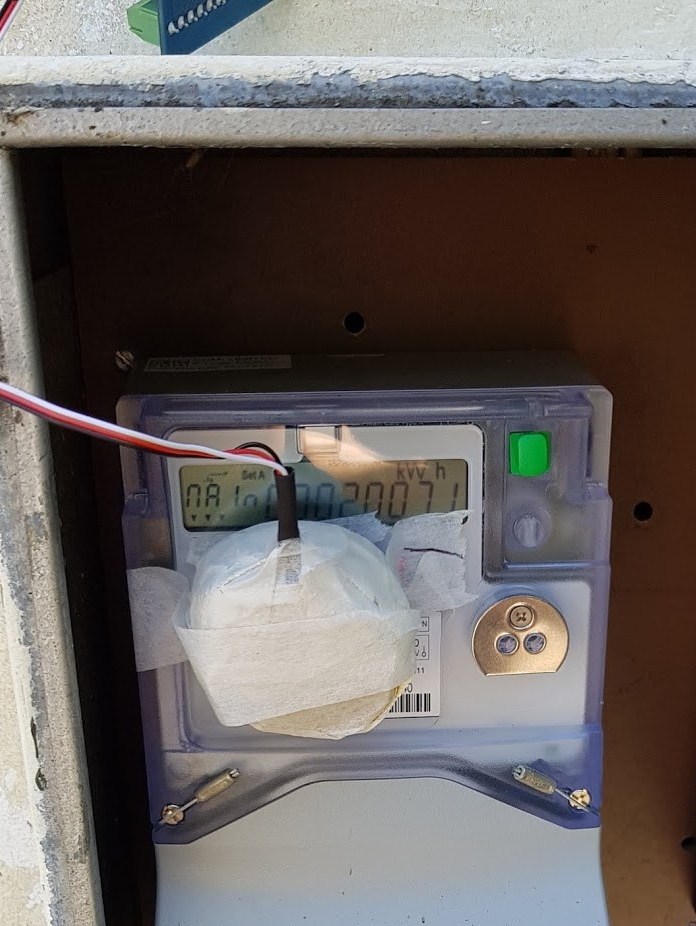
These modern meters are generally able to display the instantaneous power usage on the LCD panel, but also provide an optical indication (generally a pulsing LED), referred to as a meter pulse output, they generally look like this, you’ll see that the model below has 2 pulses. Though only Pulse 1 is enabled.
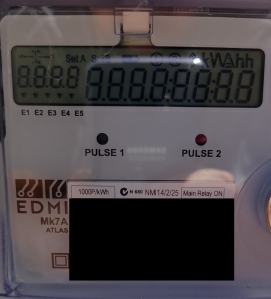
The principle is that you time the distance between the pulses of the LED. Depending on the meter, a pulse can represent a different amount of electricity consumed. For my meter each pulse represents 1 Watt Hour (1/1000th of a kWh) – you can see this indicated just above the black rectangle i’ve drawn on over the serial number. (1000P/kWh)
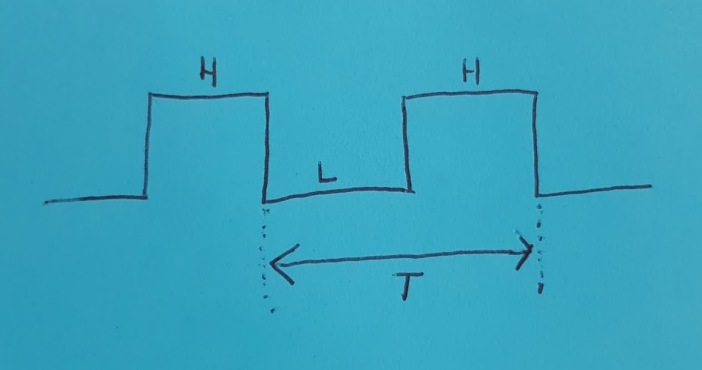
1 Watt Hour is 3600 Joules. Therefore each pulse represents 3600 joules of energy consumed. We can convert this to power (i.e. Watts) by dividing 3600 by time. If a pulse is occurring exactly every 2 seconds then the power being used at the time of measurement is 1800 Watts (P=3600/2)
The barrier to entry is pretty high for consumers to get at this kind of real time data in a meaningful way. There are exceptions to this, such as meters designed from the outset for consumers – such as the now defunct Google Power Meter.
But this kind of consumer forms a very, very low proportion of the overall market – for a metering company the demand is low for instantaneous power consumptions information in an accessible way.
For consumers there are off the shelf products such as the EmonPi which also include CT Clamps (which are a real faff and require you to separate your live and neutral wires at your breaker box – you’ll need a qualified electrician to do this for you).
The less invasive method using this kit allows you to monitor the aforementioned pulses coming from the LED on the meter itself – I did not want to go down this path – generally because they are very expensive! £183.97 (NZ$350/US$255) – but also because i enjoy making things myself.
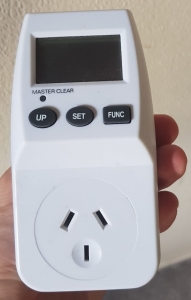
You can also get a little pluggable module that goes into a standard power socket to give you readings for anything plugged into it.
My solution
So I wanted to build something that could interpret those pulses and feed into my home sensor network. I initially started my prototype using a photoresistor with a LM393 comparator – which failed miserably. Whilst i could pick up ‘something’ from it, the changes in voltage were so low I couldn’t be sure that they were just within error margins.
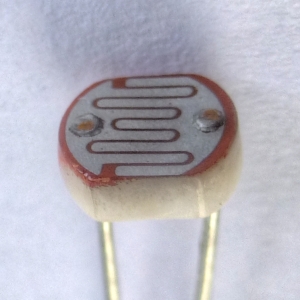
I’ll add that photoresistors are generally very sensitive to ambient light, this was not the issue as when my meter box is closed it is pitch black in there.
I was a little dismayed by the results but my friend offered to ask his father, who was an electrical engineer before he retired a couple of years ago. His father said LDRs are ‘old school’ and that I should use a photo transistor – the benefit of a transistor is I could do away with the need for a comparator circuit. (The irony of being told that I was using ‘old school’ tech by a retired engineer is not lost on me)
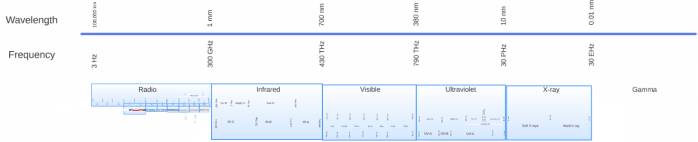
It seems that most photo transistors available in generalist stores (such as jaycar) are sensitive in the InfraRed range – the LED on my power meter is red which peaks at a wavelength of 625nm – my assumption was that it would still have a component of IR and worth an experiment – besides, it was all that was available to me without waiting for components to arrive in the mail.
Unfortunately i had no luck with an IR sensitive photo transistor.
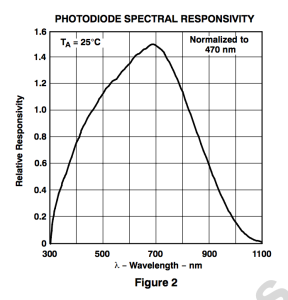
I did some research and came across the TSL257-LF Visible Light Photo Detector, it peaks at around 700nm, but crucially is still plenty sensitive at 625nm – which is what i needed!
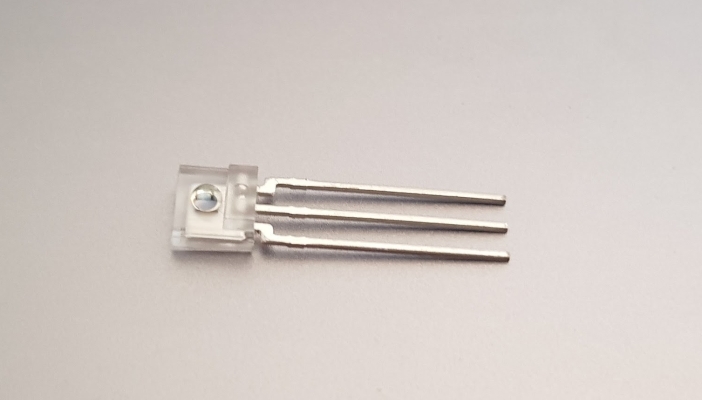
Once I had identified this component, a google search for it with “pulse monitoring” turned up a handful of results where folk had used this exact photo transistor in the application I wanted to use it for (and somebody had even designed a 3D printable light blocking mount for it) – I had googled for ‘pulse meter monitoring’ before without knowledge of this component and not come across it – hindsight eh?
I’d say that through my trial and error I learnt a lot more than if i had got the right component straight away.
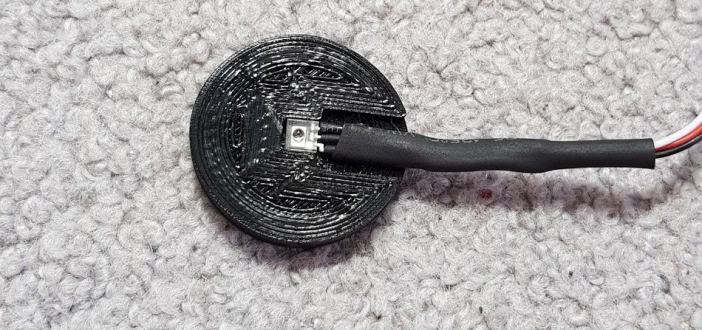
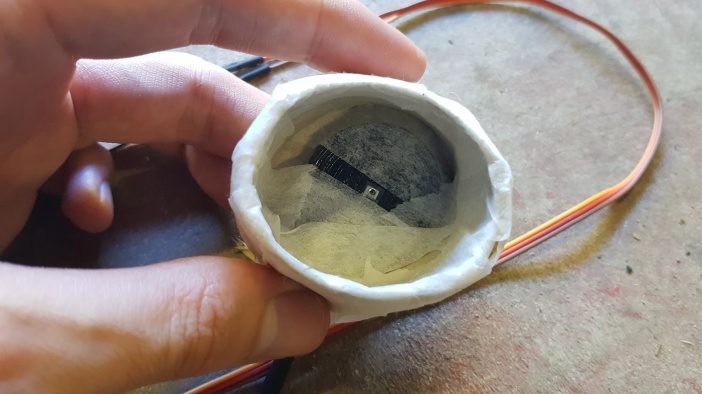
I 3D printed the aforementioned mount for it, then used a toilet roll tube (I up-cycle these a lot) and a pulsing red LED hooked up to an Arduino to work out the best distance to place the diode away from the LED to get the best results, turned out to be about 30mm.
I ended up using ADC on the Arduino to read the voltages very fast in a loop – I did read that another New Zealander – (who it turns out have actually met before at a 3D printing workshop – back when my friend and I owned our first 3D printer – a Cupcake!) – had success putting it straight into the digital input on a similar board – this unfortunately didn’t work for me. It would have been more elegant as I would have been able to use the Arduino’s digital input to detect the exact rising and falling of the pulses using interrupts. Maybe that’s something i’ll try and work out in a second revision.
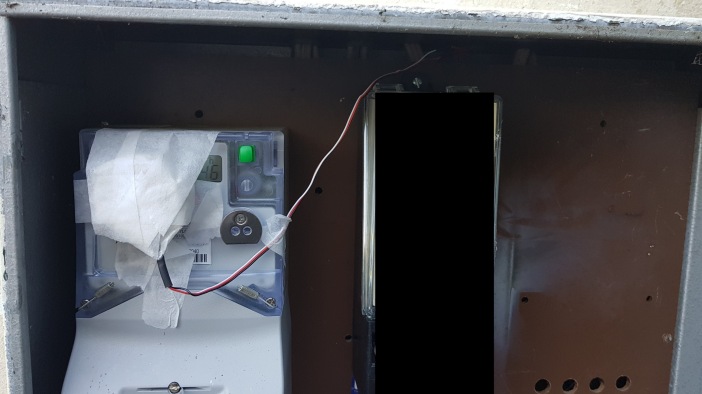
The prototype in place
I wrote some quick Arduino code to time whenever the voltage hit a certain threshold and report the time in milliseconds – as my sample rate was very high I would record the same pulse multiple times (another reason why digital input and interrupts would be more elegant)
Nevertheless I put the raw output into google sheets and worked out how to do my debouncing (not really debouncing in its purest sense, but similar in principle):
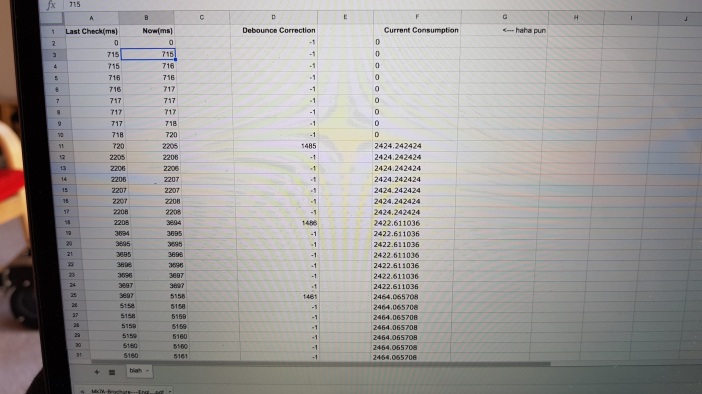
Huzzah! – Sane values!
I wired everything up and as my power meter box backs onto my garage it was easy for me to feed some servo cables through and run everything from power in the garage – rather than having to worry with the problem of powering the whole thing outdoors.
Next I needed to get the data going somewhere regularly to do some analysis and work out how well calibrated my solution was.
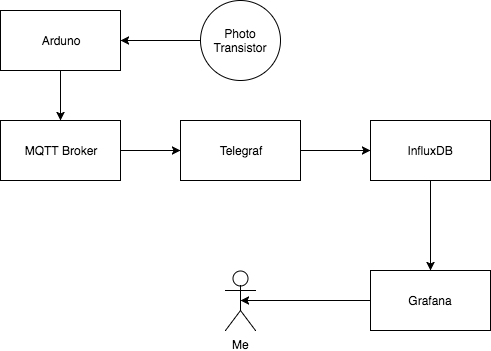
The dataflow design I went with to get the data into my existing sensor/monitoring network was using commonly available open source software and messaging protocols:
MQTT, Telegraf, InfluxDB and Grafana
Right now I have the system reporting instantaneous power consumption data every 30 seconds. I will share the Arduino code for reading the data and publishing to MQTT once i’ve finished calibration – so be sure to check back soon.
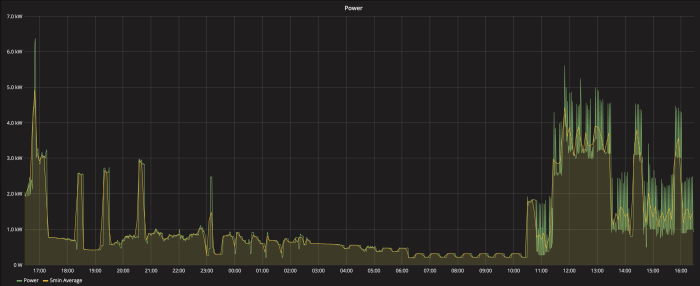
The results are very pretty and the 30 second granularity shows me some very interesting usage patterns in my house.
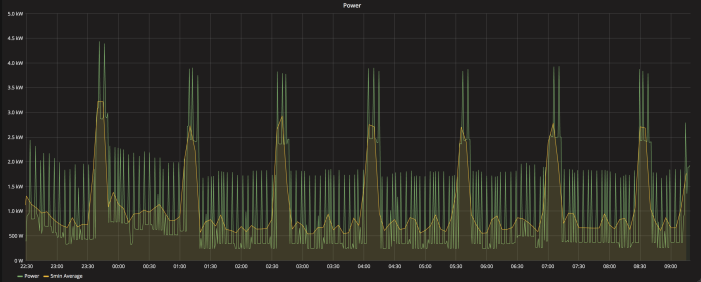
The first interesting thing you’ll see are the jagged spikes every 5 minutes or so – these are my espresso machine with it’s 1500 Watt boiler turning on to keep the water at temperature (this is a commercial coffee machine) – I could turn the coffee machine off overnight but i’ve been told on pretty good authority that the constant cycling of a copper boiler and the resultant contraction and expansion can cause cracking. So for now I leave it on 24/7 unless i’m away for a long period of time.
The second interesting observation is the spikes that occur approximately every hour and a half, this is my hot water cylinder with it’s 2000w heating element.
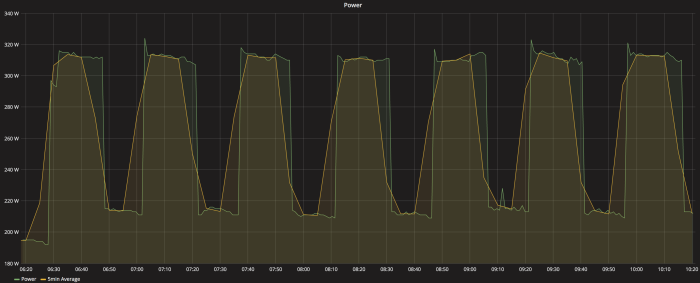
I turned off both the hot water cylinder and the coffee machine over night to confirm this and with all of that noise from the hot water cylinder and coffee machine gone I discovered something else with some periodicity – I say ‘found’ though i’ve not worked out exactly what it is yet – but my money is on my fridge.
All of the data so far seems to suggest i’ve got my code pretty well tuned on my first attempt. But i’ll leave it running for a week and see how it compares to my utility bill.


